


Here is what we were up to this month!
More integrations
As we have shown Data Narratives to more people, we’ve been asked “this is cool, can I integrate this with [interface-name]?” more times than we can count. Now, you can! We have rearchitected our app so it can be integrated it with other interfaces super easily.
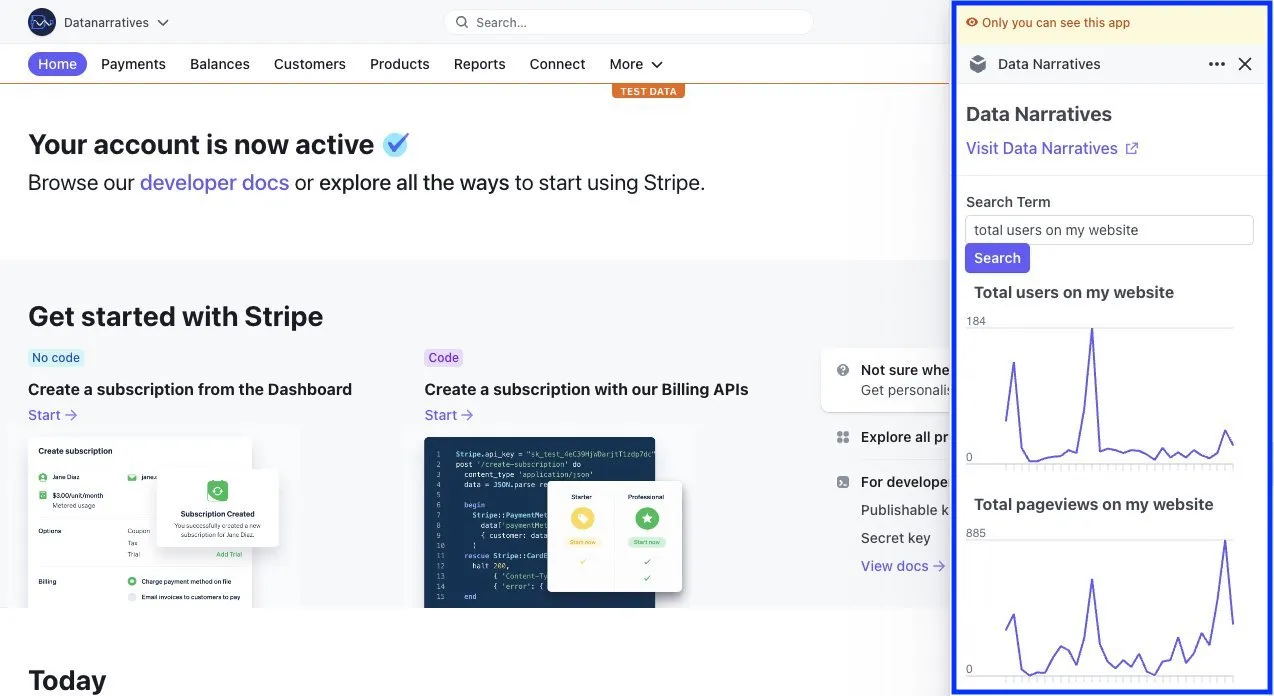
The first of these will be Stripe Apps. We were in the first batch of companies to be given access to Stripe Apps, and (pending Stripe review), you will soon be able to search for all of your data on Data Narratives from Stripe.
Soon, we will extend this functionality to CMSes, chat interfaces (like Slack, Teams, Zoom video chats), and more.
A web analytics engine
One of the biggest frustrations we have heard from users have been about the limitations of Google Analytics. They want to add their own user ids and measure things like active time spent, scroll depth, and more “advanced” metrics – but just cannot do this in Google Analytics. And alternatives like Amplitude Analytics are way too expensive.
So we have created our own analytics engine. We will roll it out to beta users on December 1. If you would like to test this out for your website, please email me at rishabh[at]datanarratives.com or say hi on Twitter @rishdotblog!
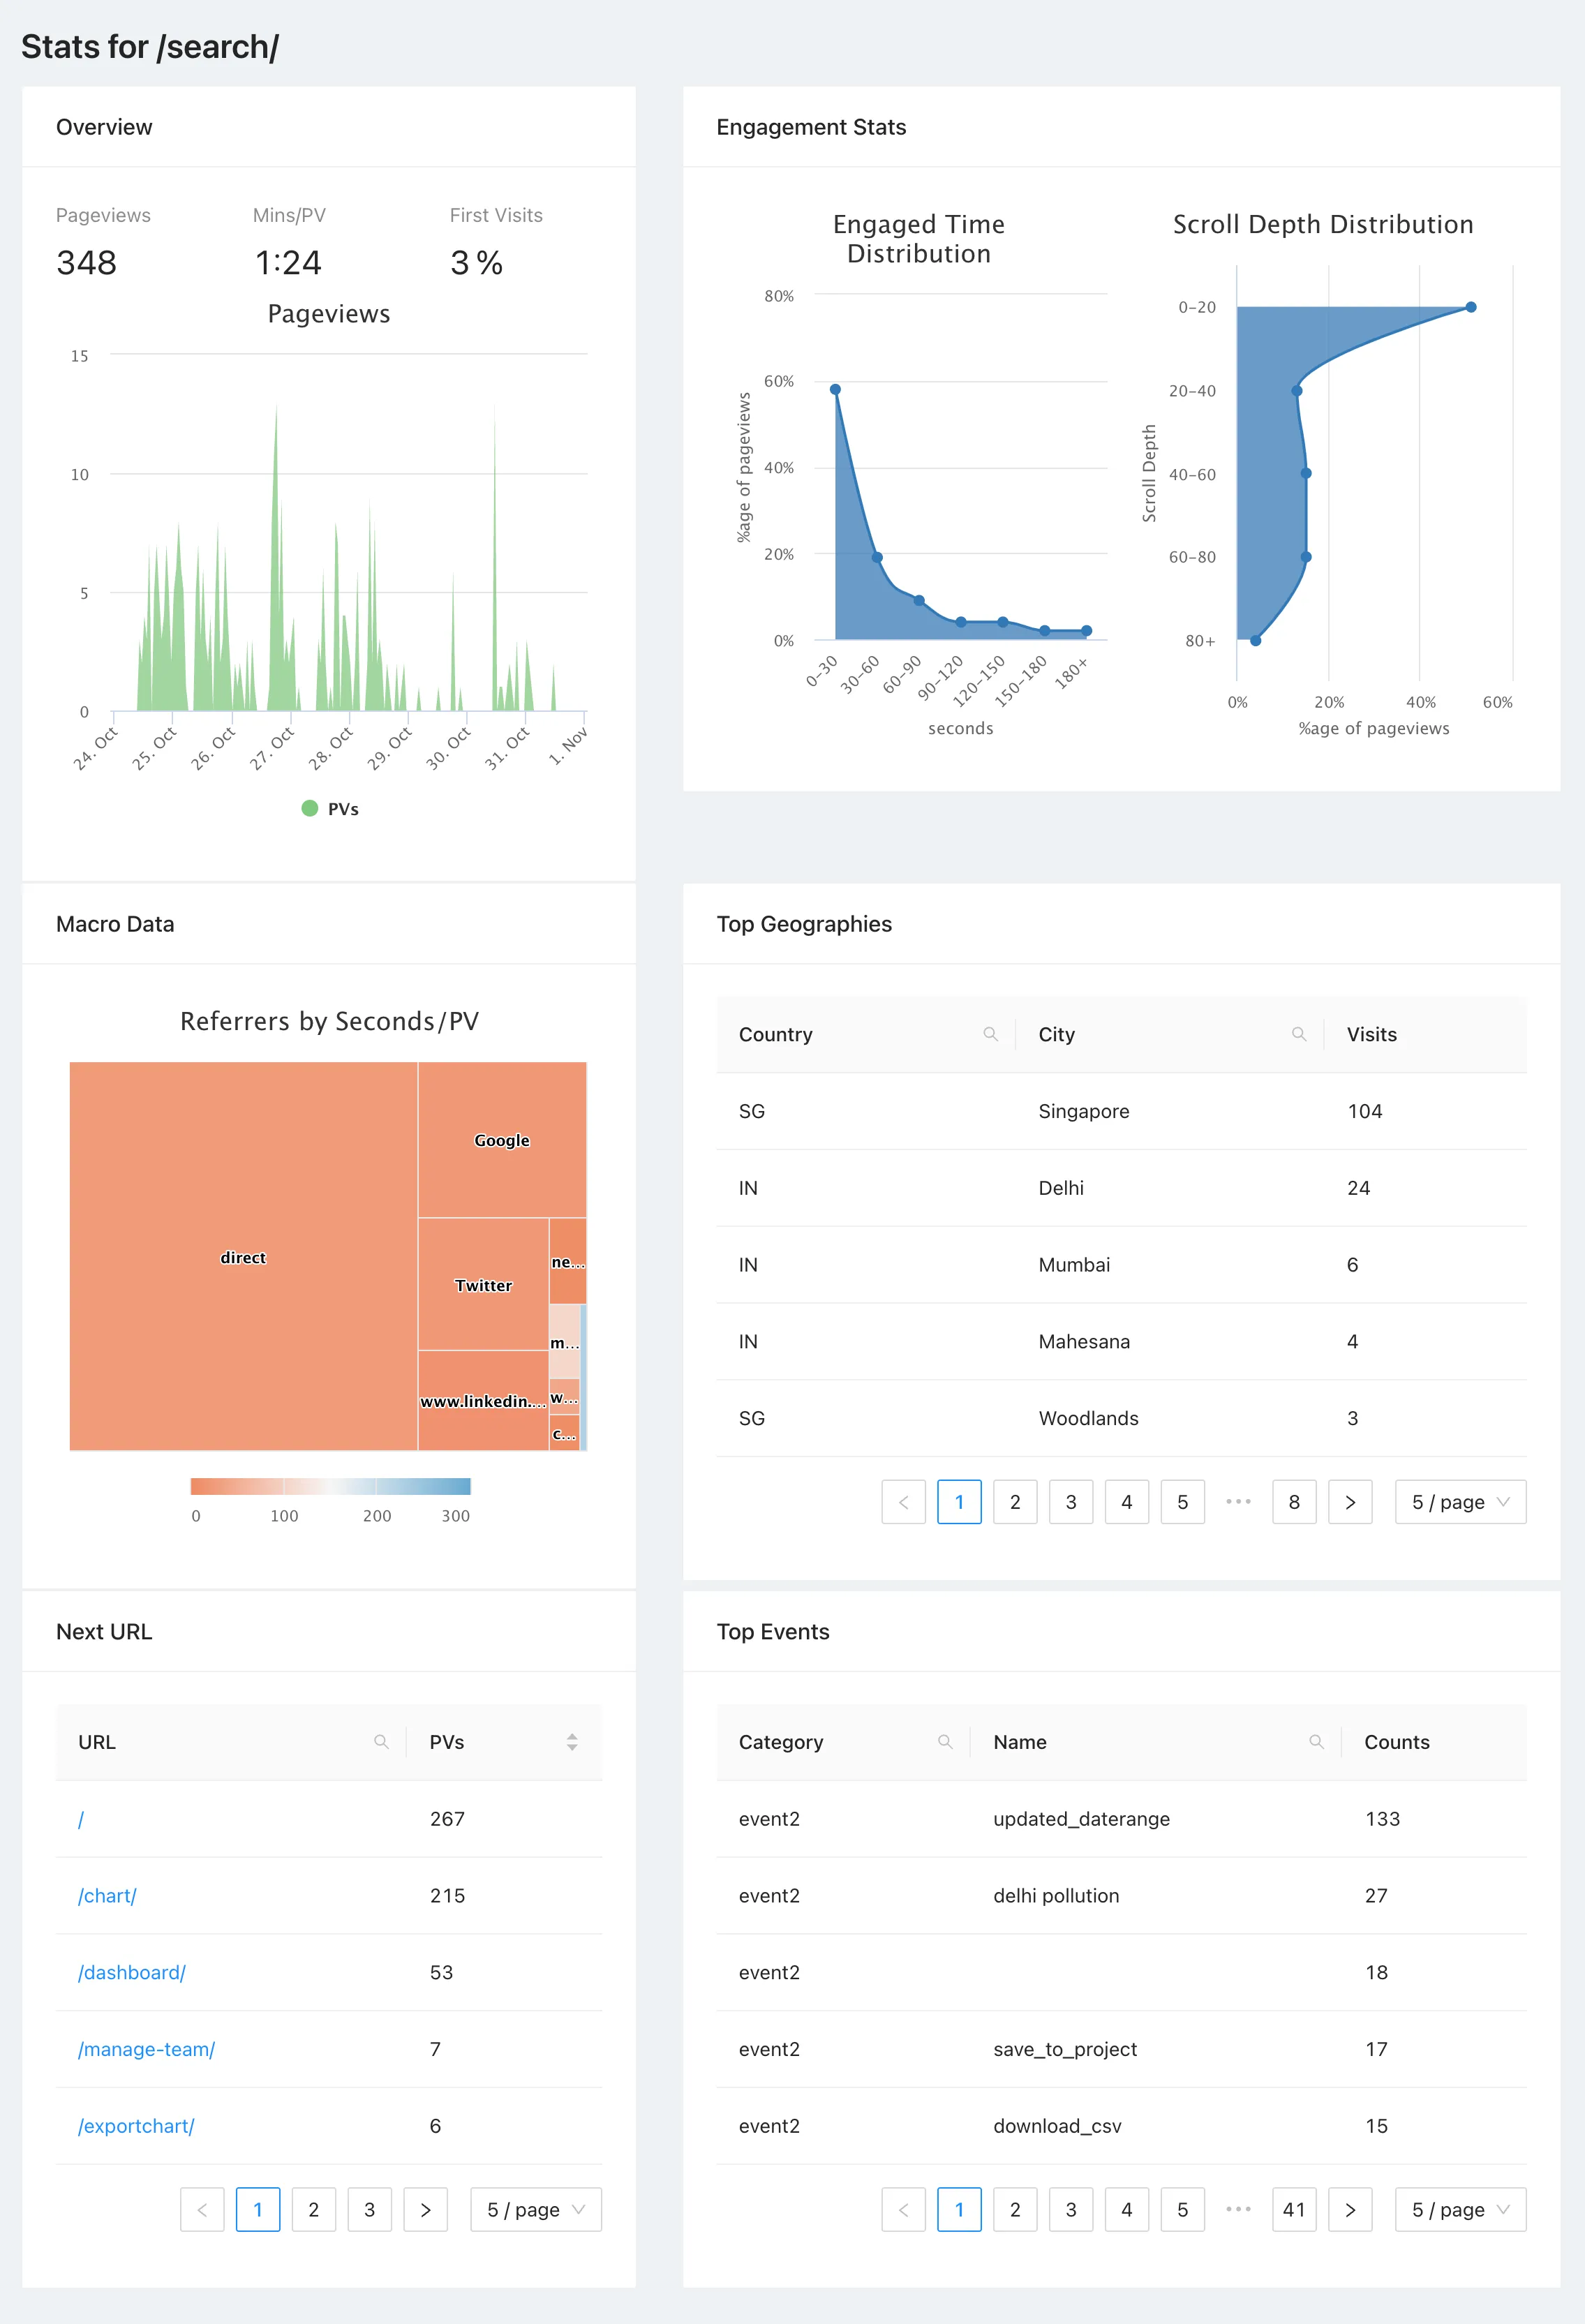
You will soon be able to enrich the rich data obtained from here with other sources, like Stripe, Shopify, and more.
Better dashboard and collaboration features
We have been blown away by how much our users like the ability to create dashboards! Now, you can do many powerful things within the dashboard.
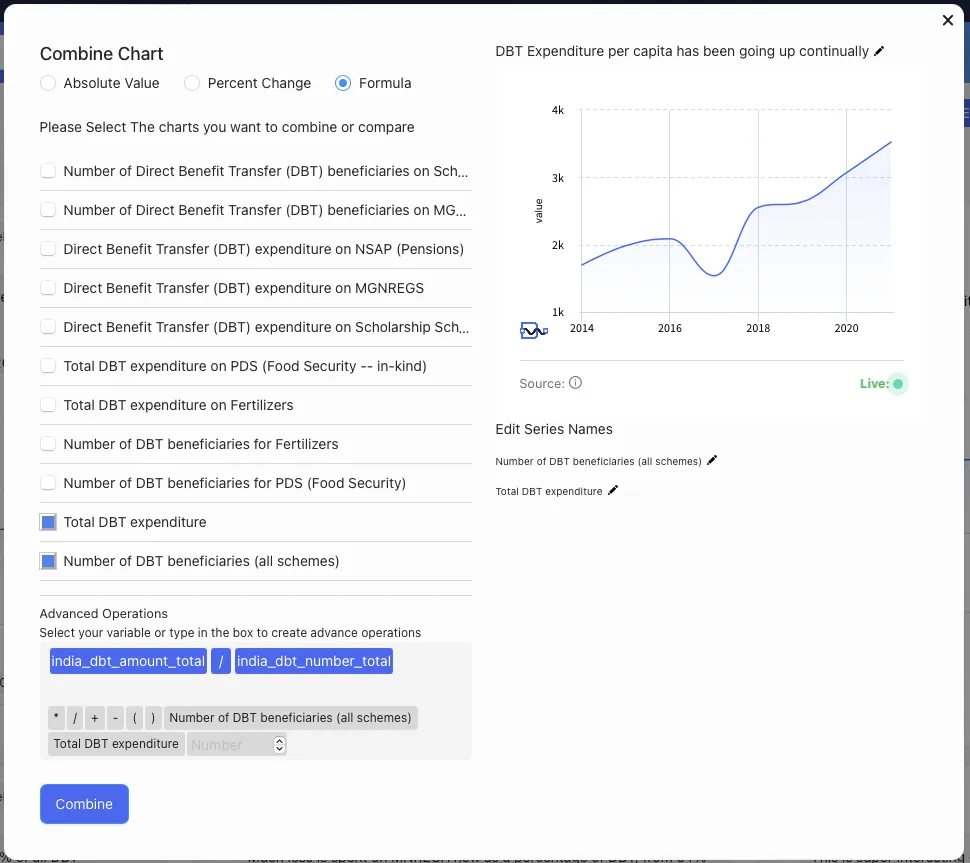
Formula Charts
You can now create “formula charts” to perform nifty mathematical operations visually, without ever opening a spreadsheet
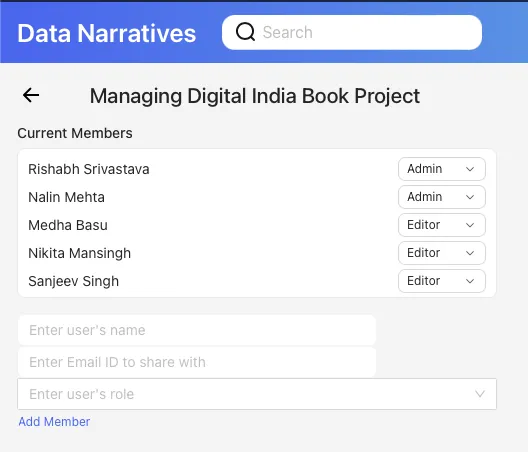
Teams
You can now create teams, and share dashboards with teams, instead of adding each team member individually. This was requested by all of our enterprise customers, and we are glad that it is now ready.
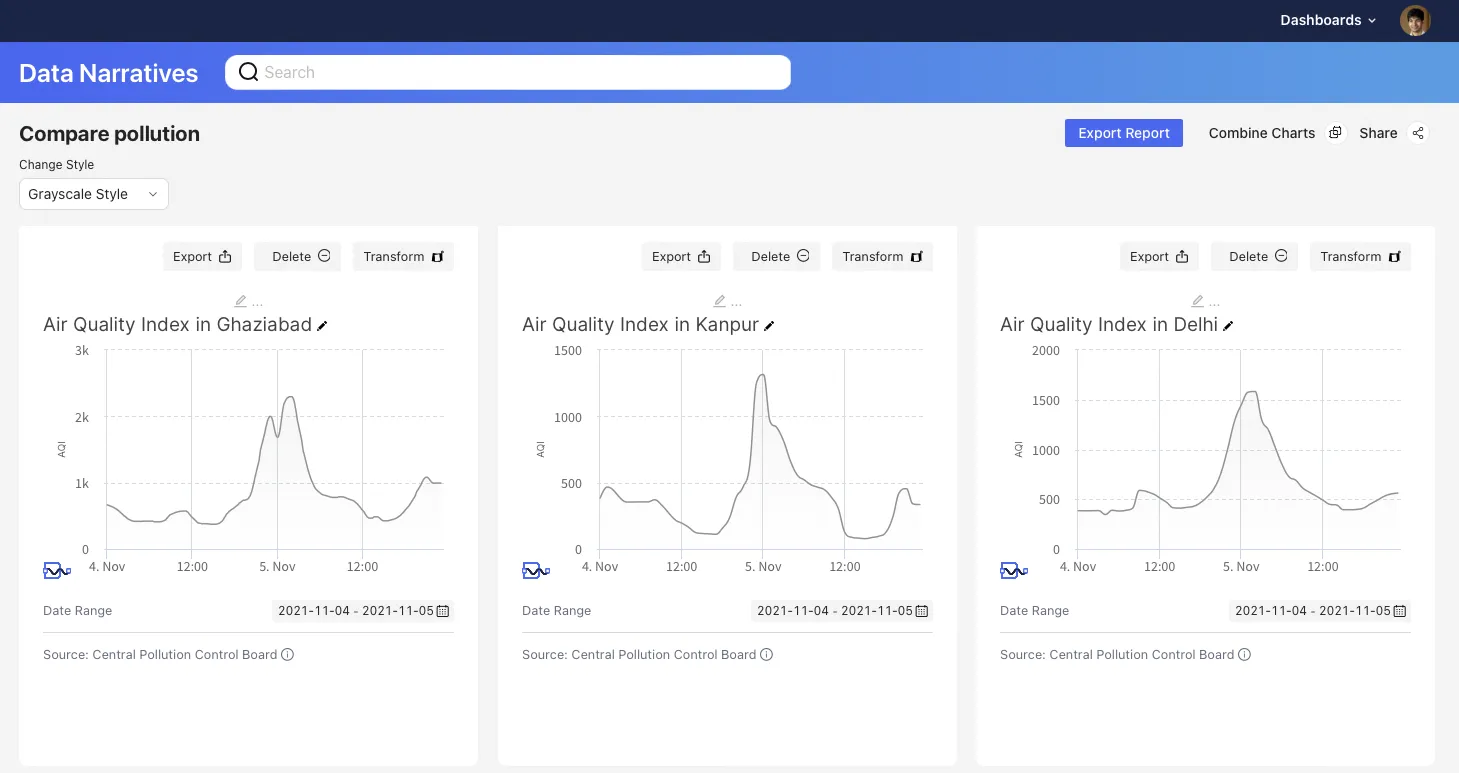
Dashboard level styles
Many users also wanted to dashboard level styles instead of global org styles, and this is available now! You can easily add styles to a given dashboard, and make them thematically appropriate.
A better search experience
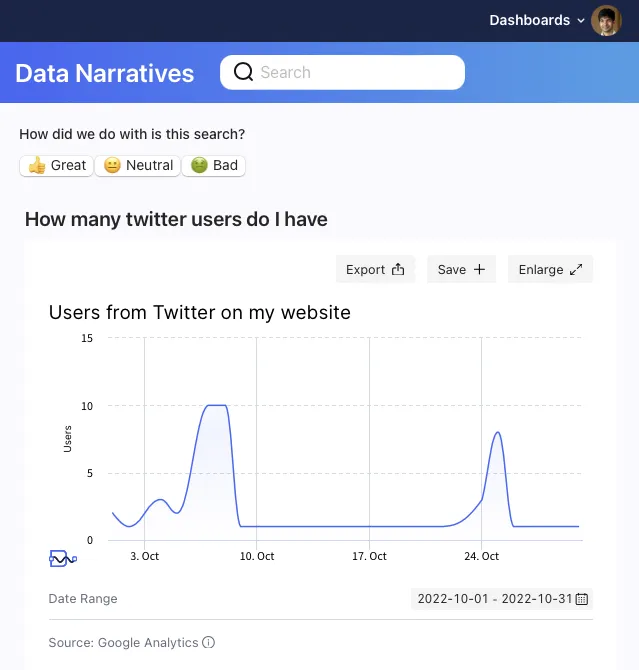
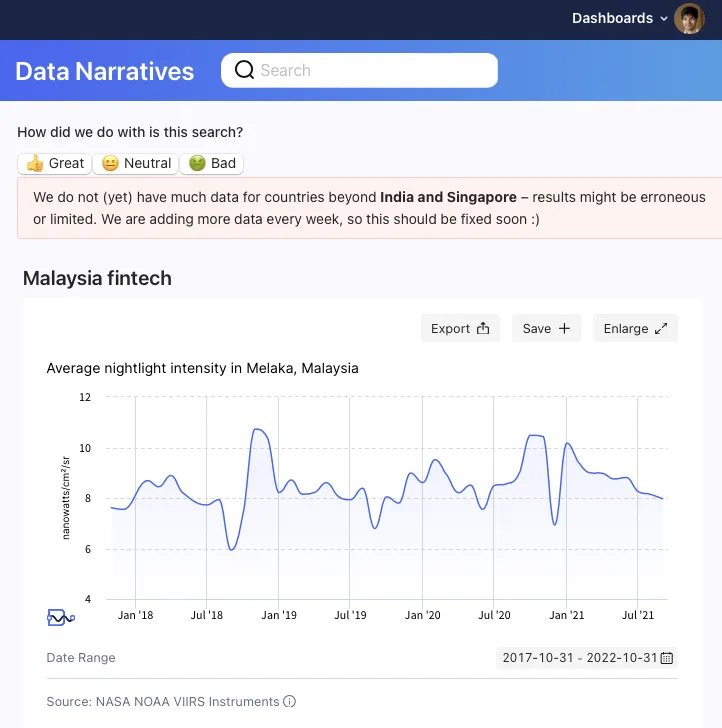
Our biggest complaint received so far has been the quality of our search engine. It sometimes returns results that are only tangentially related to what a user is looking for, and that can be frustrating. Just last week, a frustrated user told us that Nightlight Intensity charts for different Malaysian states popped up when they were searching for data about Malaysian fintech.
We promise to fix our search engine once and for all in November. But in the meantime, we have implemented two changes.
Internal query intent detection
When users are searching for internal data (like what happened on their website), they sometimes got charts about external data as well. This was a jarring experience. So we have implemented a query intent detector that keeps search results to internal data only. Like here – earlier, our search engine would also show charts for Twitter (the company’s) users and revenues.
Location specific warnings for external data
If you search for data from cities or countries for which we do not currently have data, you will get a warning that data is not yet available
Up Next
Better realtime collaboration, integrations with many more data sources (including Postgres, Snowflake, BigQuery, and Redshift clusters), and a better search engine are coming up in November!
Enjoyed this post or have follow up questions? Do drop a note to @rishdotblog on Twitter or send an email to rishabh[at]datanarratives.com!
← More blogs