

Times Internet is one of the largest internet conglomerates in India. Before they began working with Data Narratives, they wanted to become a frontrunner in data journalism and storytelling, but had found that the process expensive and time-consuming
Before they started using Data Narratives, Times Internet’s content teams relied on their data teams to go through PDFs and excel files to extract, clean and chart data. That data then went to the design team that prepared the visual for publishing. In a fast-moving news environment, this drastically limited their ability to experiment.
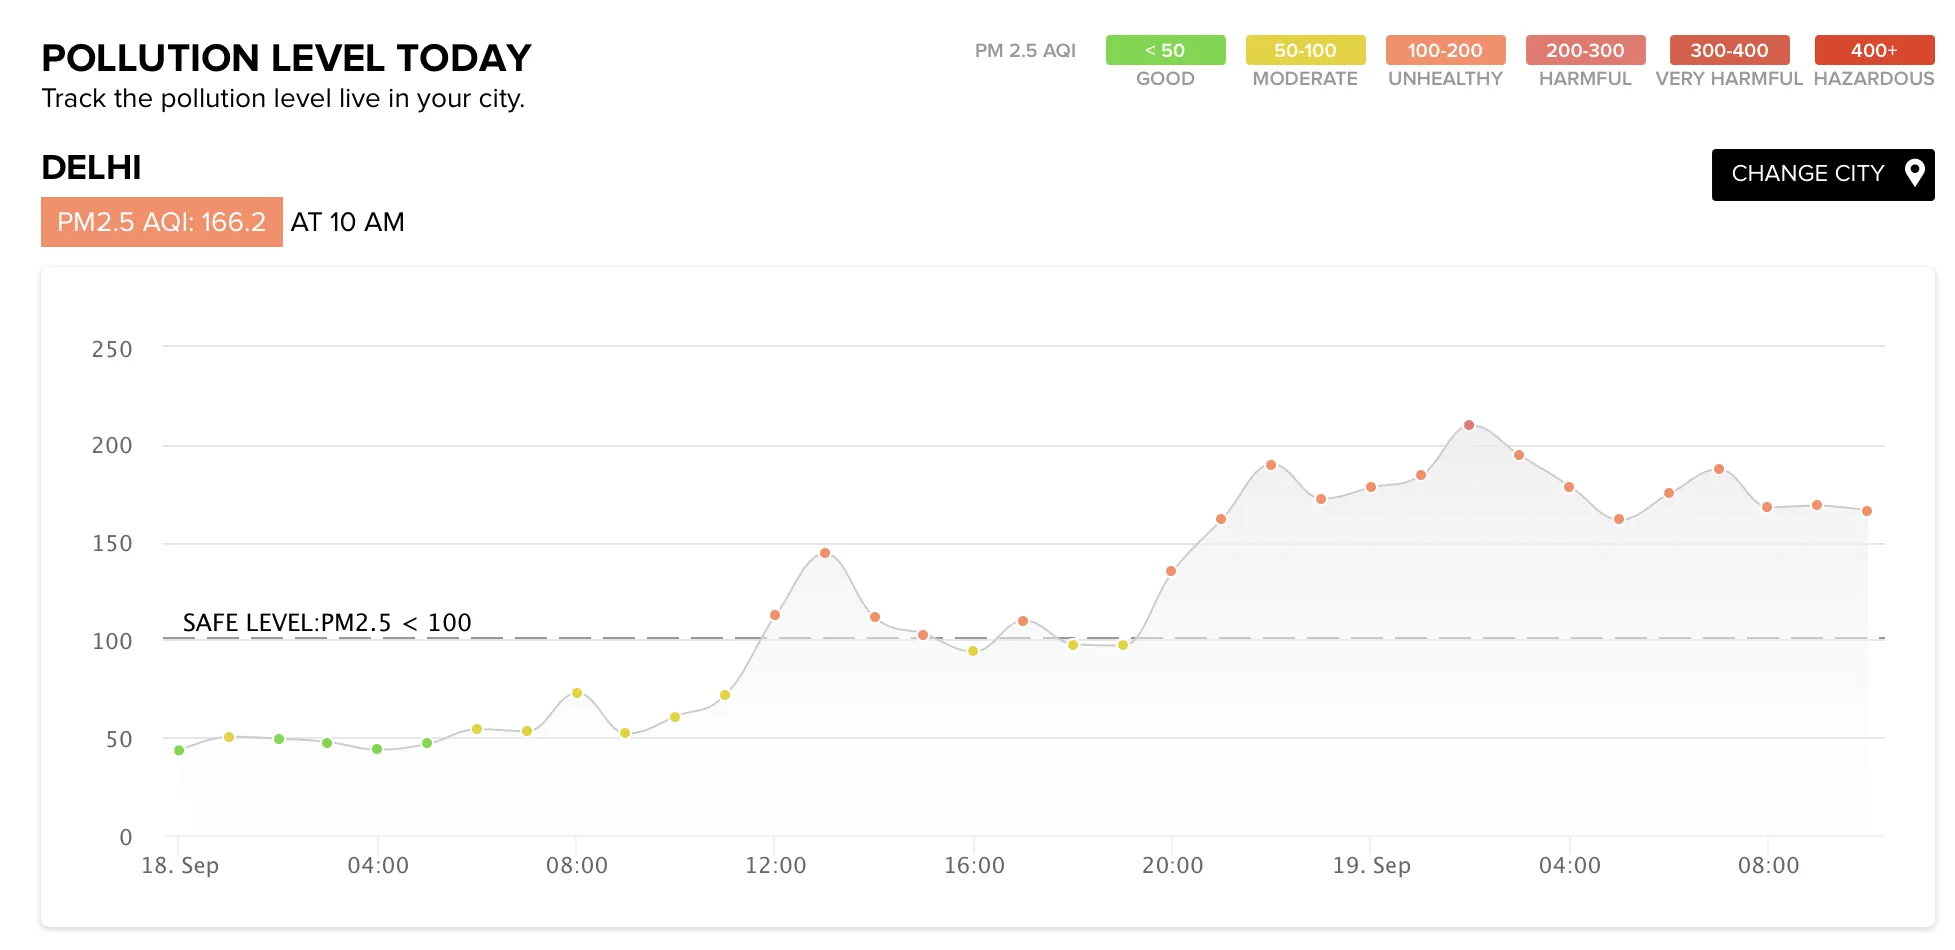
Data Narratives solved this problem by creating real-time updating dashboards for high frequency data like pollution – one of the most searched for topics in the country. We provided data feeds that would get automatically visualised on Times Internet’s pages and were auto-updating. The dashboards were a huge success, with 7 figure pageviews on the first day, and made Times Internet a pioneer in the space.
Driving record-high pageviews
This expanded to a pilot to use Data Narratives for high-impact events like budget and election coverage. On election and budget nights, editorial teams don’t know exactly when they’ll get the data and have tight deadlines to turn that data into stories. As a workaround prior to Data Narratives, the teams made multiple versions of each graphic, days in advance and without a clue of what the data might show. On results day, of course, a lot of this had to be re-done.
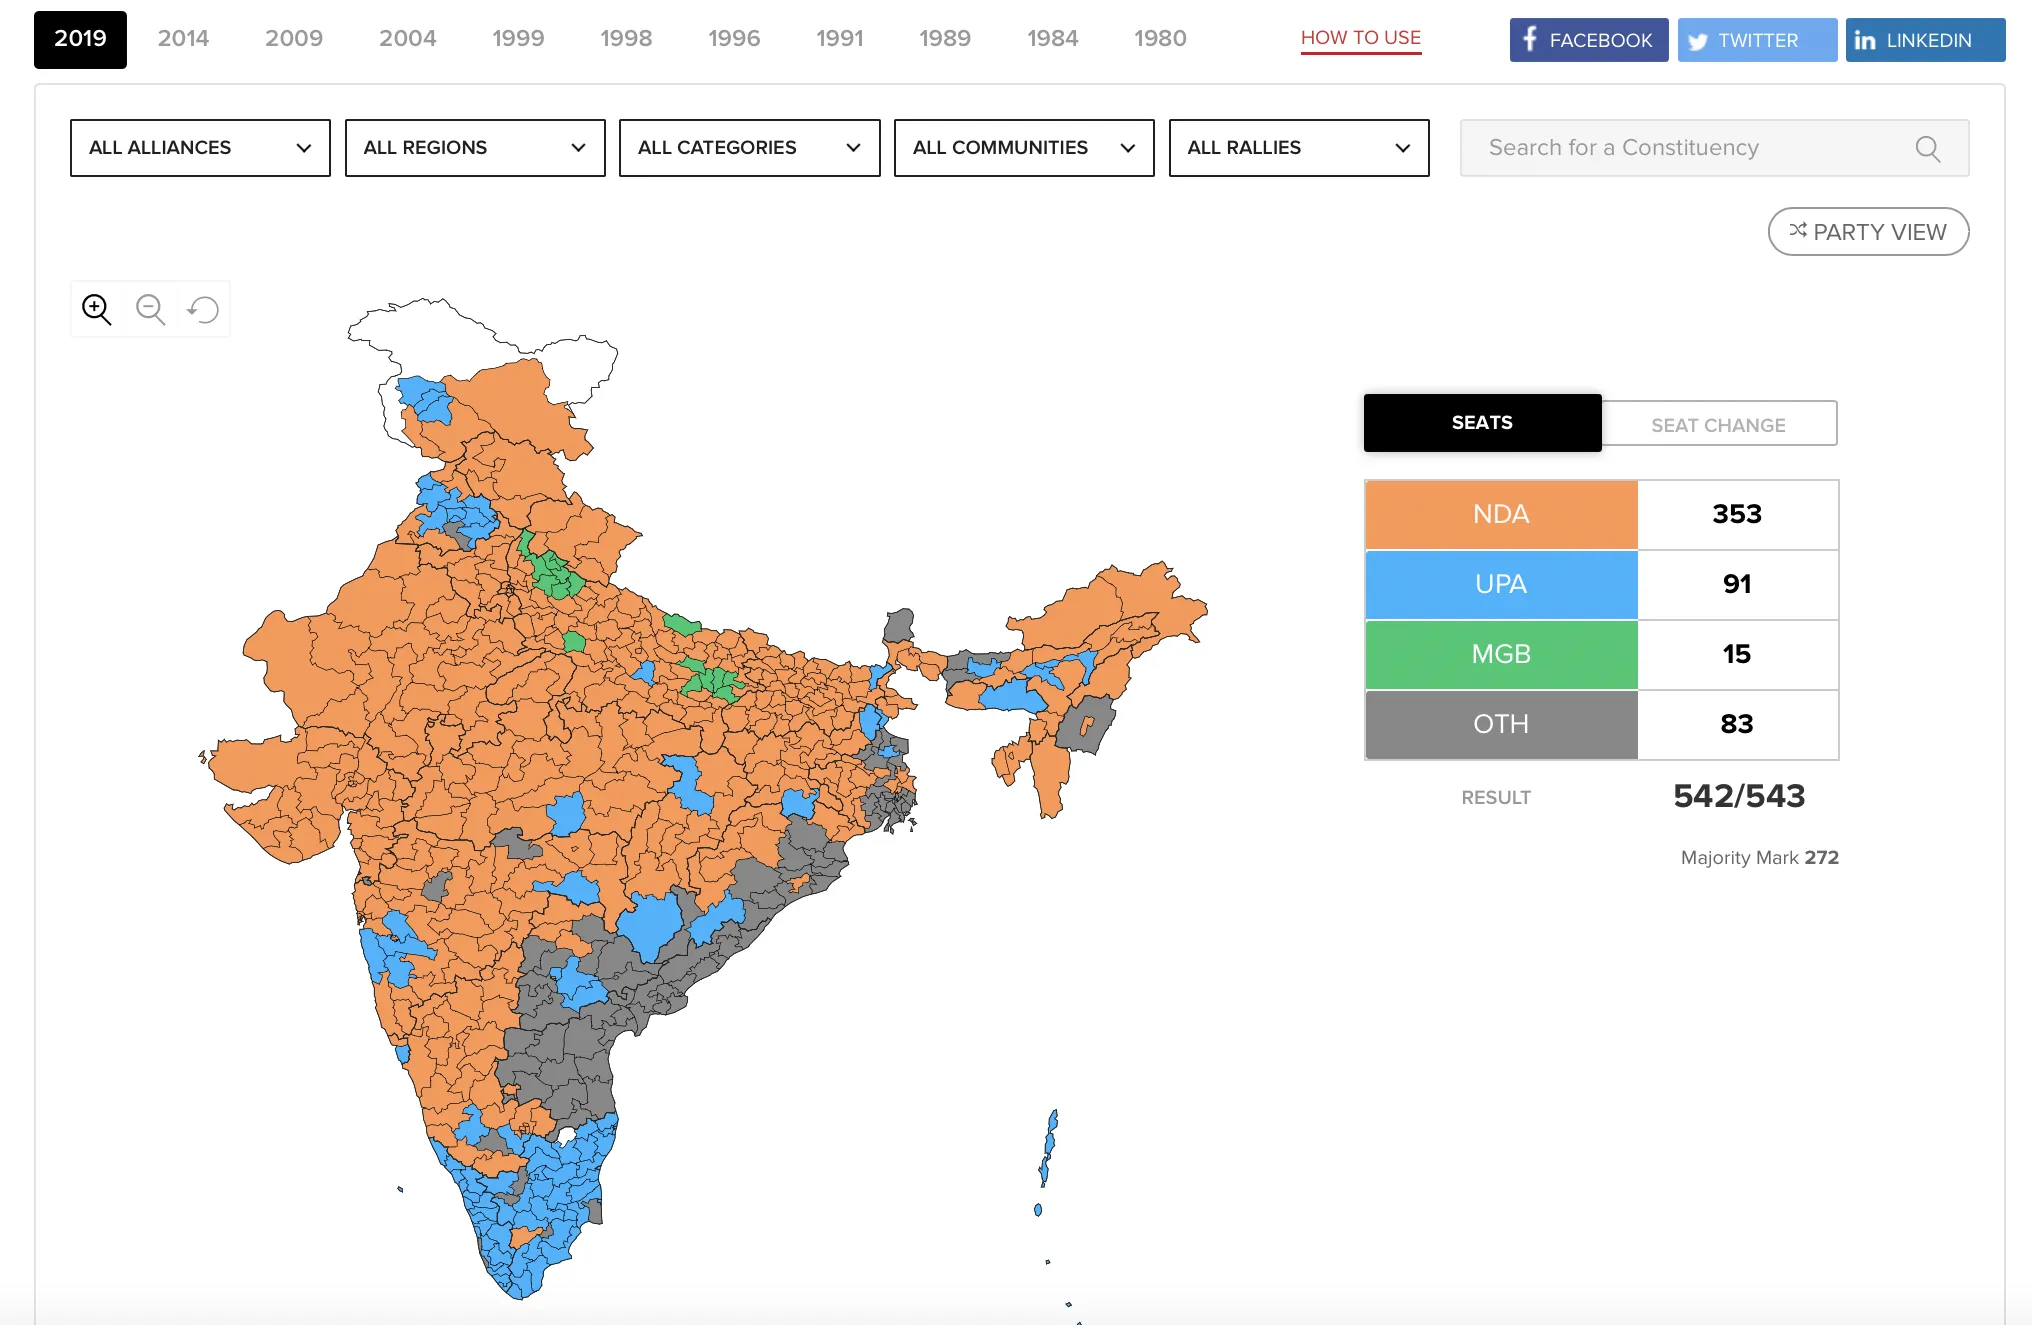
Data Narratives converted what used to take a minimum of 4 people 6-10 hours each into something that can be done by 1 person in 10 minutes. With Data Narratives, journalists got dashboards with both historical data and the latest data as soon as it rolled in, all automatically visualised.
They could filter data, drill down into constituent-level maps, and see locally-relevant patterns immediately. Designers could move away from manually colour-coding maps, and invest the time in more ambitious work. The pilots were a huge success, and led to the best performing days for Times Internet with over 9-figure unique visitors in a single day.
“We did ambitious things that were just not possible before. During the election coverage, 95% of the graphics came from Data Narratives. We could only do rich analysis quickly because data acquisition and basic visualisation was completely automated,” said Sajeev Kumarapuram, Head of Design at Times Internet.
Collaboration across the newsroom
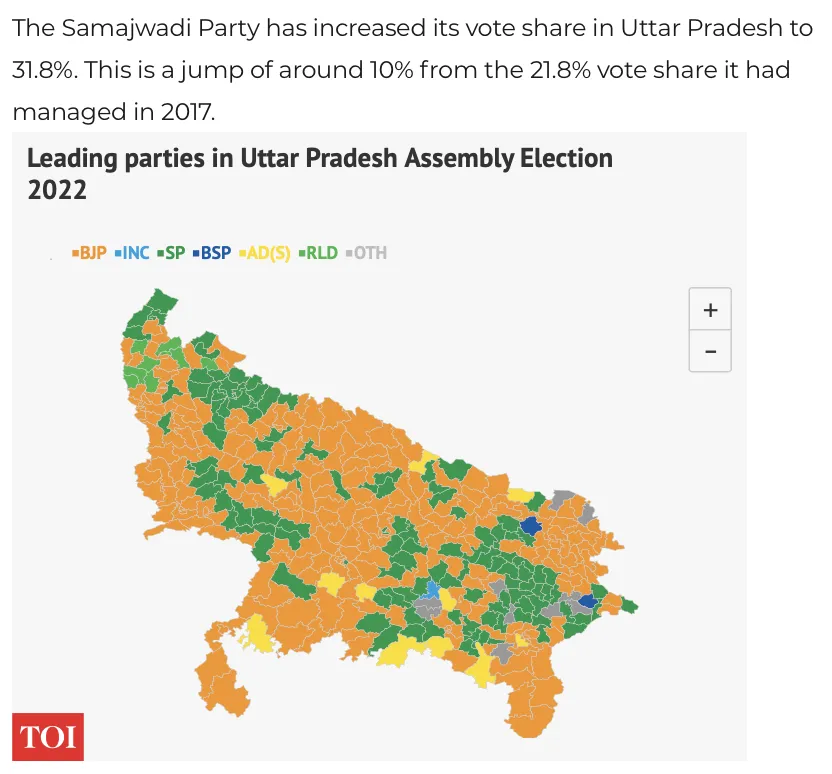
Times Internet has used Data Narratives for every election and budget coverage since. In the 2022 state elections, our dashboards were used to power new elements such as live blogs. Journalists used Data Narratives to collaborate with editors and colleagues in real-time.
They sliced the data as it came in, uncovered new angles and immediately crafted a narrative right within the platform. They shared their dashboards with editors and colleagues to get feedback and make edits which were immediately visible to everyone on the team. The speed of collaboration allowed the team to keep up with the news.
“It’s the ability to create dashboards and instantly share them with colleagues that is a true moment of product delight,” said Rohit Saran, Times Internet’s Chief Editor.
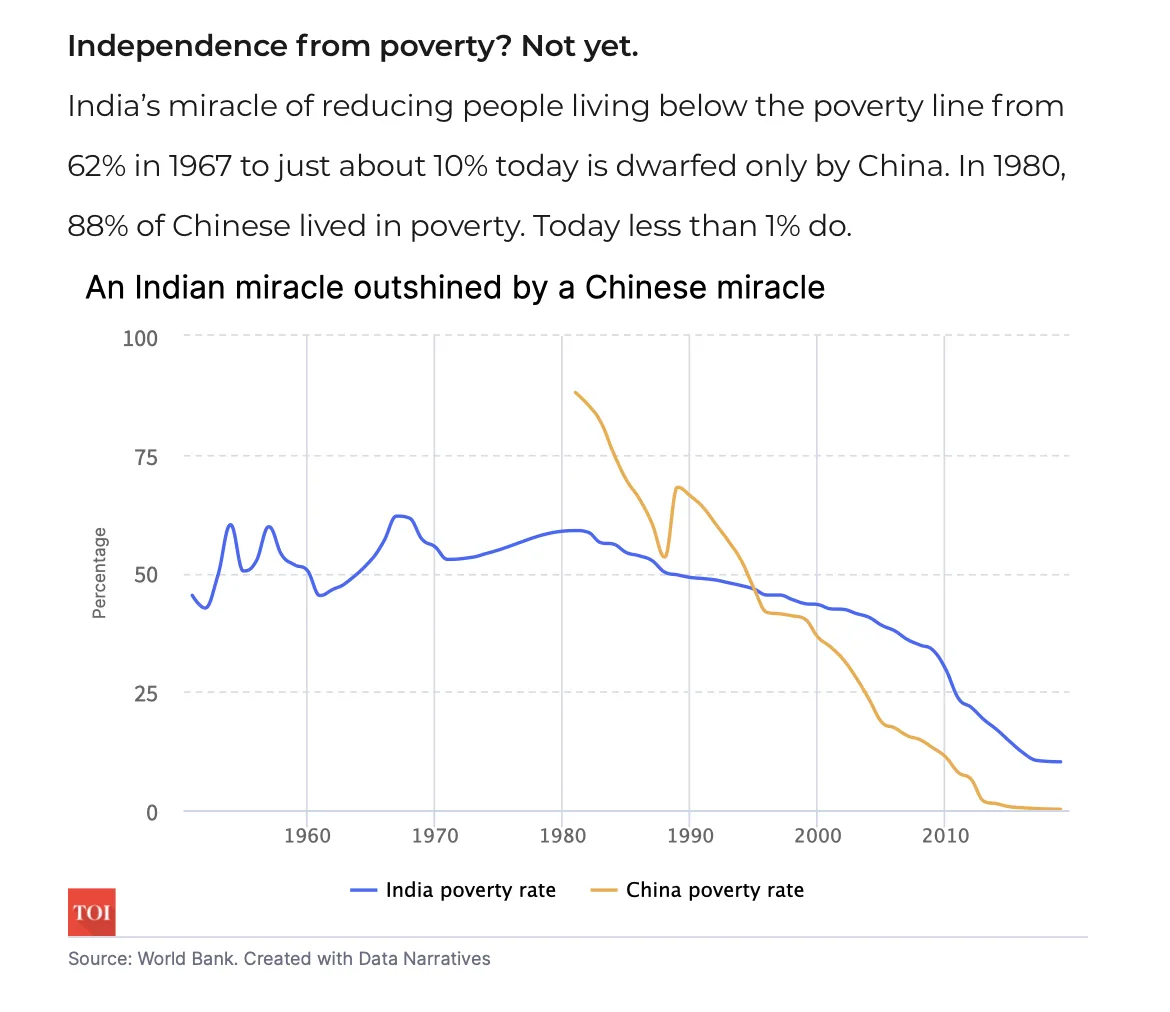
For its special coverage of India’s 75th year of independence, Times Internet used Data Narratives features to visually combine economic data from numerous sources and collaborate across the editorial team to chart and analyse India’s growth from 1947 to 2022.
With Data Narratives, Times Internet has taken the lead in creating and launching new digital products, driven record-high audiences and enabled its people to focus on creativity rather than grunt work with a revamped data journalism process.
← More case studies